
For over a century, the United States was the world’s safest borrower. That era, quietly, is over.
As of August 2026, the yield on the U.S. 10 year Treasury sits at roughly 4.6%.1 That number might sound small and technical. It isn’t. It’s the market’s verdict on America’s finances, delivered every single day and lately, that verdict has been getting more expensive.
The Country That Owes More Than Anyone, Ever
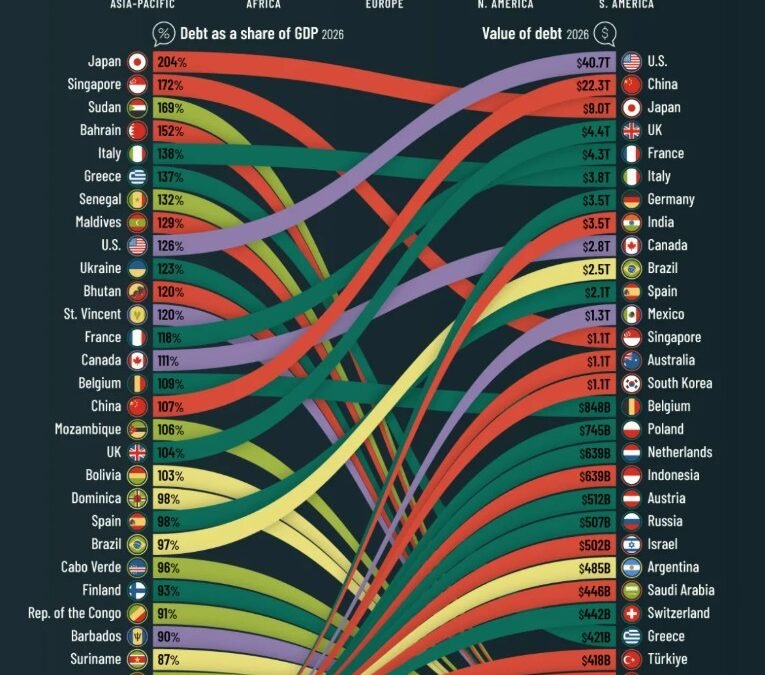
The U.S. is projected to carry $40.7 trillion in government debt in 2026, more than the combined government debt of China, Japan, the United Kingdom, and France, sitting at roughly 126% of GDP. 2
To put that in perspective: outside of a brief pandemic era spike, the only other time in American history that debt exceeded the size of the entire economy was for two years right after World War II. 3 There was no world war this time. Just decades of spending more than was collected, one budget at a time.
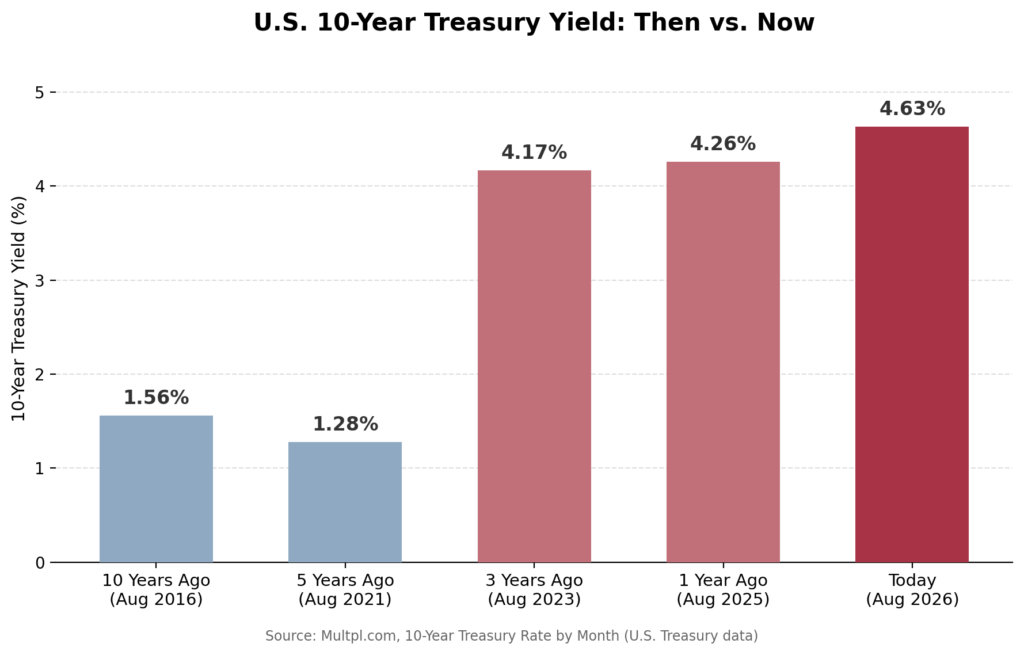
The chart above shows just how far borrowing costs have shifted. 4 The yield has nearly tripled since 2016 and more than tripled since 2021, most of that climb happened during the Fed’s aggressive rate hikes of 2022, and yields have stayed elevated ever since rather than coming back down.
The Downgrade Nobody Saw Coming, Then Everybody Did
For decades, one thing stayed constant even as U.S. debt climbed: Moody’s kept America’s rating at a perfect AAA, even through the 2008 financial crisis, S&P’s downgrade in 2011, and Fitch’s downgrade in 2023. Then, in May 2025, Moody’s stripped the United States of its final AAA rating, dropping it to Aa1 and citing more than a decade of rising government debt and interest costs relative to other highly rated countries.5 For the first time in over 100 years, the U.S. does not hold a top tier credit rating from a single major agency.
Nobody rang a bell. The news landed quietly and life went on. But the bond market noticed. It always does.
Canada, just across the border, continues to hold a AAA credit rating from the major agencies as of 2026.6 Same neighborhood, very different verdict and that gap in confidence is part of why U.S. yields sit meaningfully above Canada’s today.
The Feedback Loop Nobody Wants to Talk About
Rising yields don’t just reflect America’s debt problem. They make it worse. More government borrowing floods the market with new bonds, pushing yields up to attract buyers. Higher yields mean it costs more to service existing debt. More interest costs mean bigger deficits, which mean more borrowing, which means more bonds hitting the market. The cycle feeds itself.
It’s the fiscal equivalent of paying down one credit card with another, except the credit card is the world’s reserve currency.
Why This Matters Beyond the Headlines
This isn’t purely academic for Canadian business owners. A widening gap between U.S. and Canadian yields has real downstream effects:
- Rising U.S. Treasury yields tend to pull other U.S. borrowing costs up with them, including mortgages, corporate debt, and financing costs generally, which affects any Canadian business with U.S. revenue, U.S. suppliers, or U.S. denominated debt.
- Diverging yields and credit outlooks between the two countries can influence currency movements, which matters for cross border pricing, purchasing, and margins.
- For anyone managing personal or corporate wealth, sovereign bond yields are a useful barometer for broader fixed income return expectations and risk pricing across the market.
What a Rising Yield Is Actually Telling You
A government paying more to borrow isn’t commanding a premium the way a thriving business might. It’s the market pricing in more risk and asking, in the language of basis points, whether the current trajectory ever gets corrected. For a country carrying the largest debt load in history, that’s not a rhetorical question.
Citations
- Trading Economics, U.S. 10 Year Treasury Note Yield, August 5, 2026: https://tradingeconomics.com/united-states/government-bond-yield ↩︎
- Visual Capitalist, “Ranked: The World’s Most Indebted Countries in 2026,” using IMF World Economic Outlook data: https://www.visualcapitalist.com/ranked-countries-with-most-government-debt-in-2026/ ↩︎
- onsible Federal Budget, “Debt Reaches 100% of GDP,” April 30, 2026: https://www.crfb.org/blogs/debt-surpasses-size-economy ↩︎
- Multpl.com, 10 Year Treasury Rate by Month, sourced from U.S. Treasury data: https://www.multpl.com/10-year-treasury-rate/table/by-month ↩︎
- CNN Business, “The United States just lost its last perfect credit rating,” May 16, 2025: https://www.cnn.com/2025/05/16/business/moody-us-credit ↩︎
- Dave Manuel, Canada Debt Clock, August 2026: https://www.davemanuel.com/canada-debt-clock.php ↩︎